Table of Contents
The Big Bash League (BBL) is Australia’s premier T20 cricket competition and one of the most popular franchise leagues in the world. Since its launch in 2011, the tournament has featured exciting matches, international stars, and intense battles for playoff qualification. Every season, fans closely follow the standings because the points table determines which teams advance to the finals. The race for the top four positions is often highly competitive, with net run rate playing a crucial role in deciding rankings. Understanding the Big Bash League standings provides valuable insight into team performance, qualification chances, and championship contenders. This article explores the latest standings, recent form, playoff race, team performances, and major records from the BBL season.
Current Standings
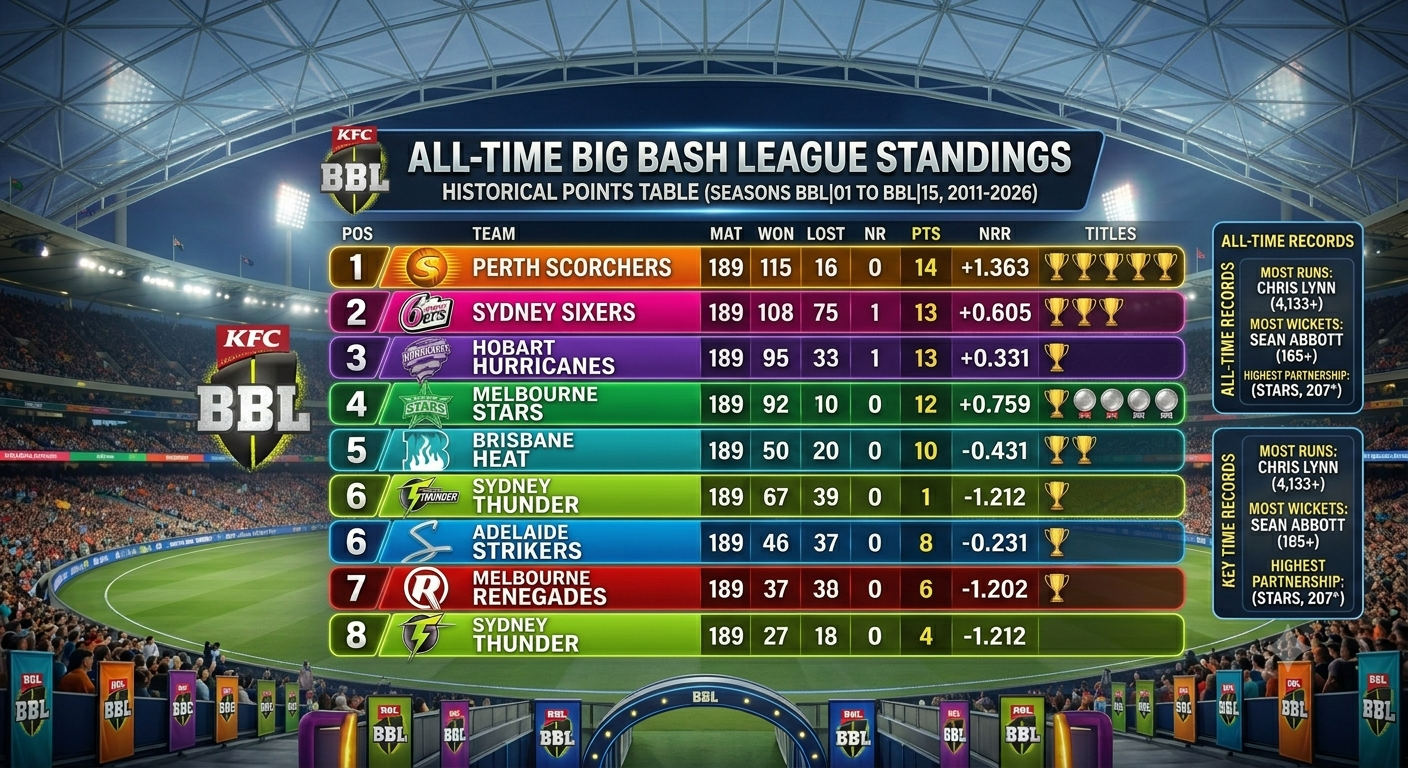
The BBL points table is based on wins, losses, points earned, and net run rate.
| Team | Matches | Wins | Losses | Points | Net Run Rate |
|---|---|---|---|---|---|
| Perth Scorchers | 10 | 7 | 3 | 14 | +1.363 |
| Sydney Sixers | 10 | 6 | 3 | 13 | +0.605 |
| Hobart Hurricanes | 10 | 6 | 3 | 13 | +0.331 |
| Melbourne Stars | 10 | 6 | 4 | 12 | +0.759 |
| Brisbane Heat | 10 | 5 | 5 | 10 | -0.431 |
| Adelaide Strikers | 10 | 4 | 6 | 8 | -0.231 |
| Melbourne Renegades | 10 | 3 | 7 | 6 | -1.202 |
| Sydney Thunder | 10 | 2 | 8 | 4 | -1.212 |
Perth Scorchers finished at the top of the standings after a dominant league-stage campaign. Sydney Sixers, Hobart Hurricanes, and Melbourne Stars also secured playoff qualification.
Position in the Tournament
The standings reflected the consistency shown by Perth Scorchers throughout the season. They recorded the highest number of victories and maintained the strongest net run rate among all teams.
Sydney Sixers and Hobart Hurricanes finished level on points, but the Sixers claimed a higher position due to their superior net run rate. Melbourne Stars secured the final playoff spot after a strong finish to the league stage.
Recent Form
Recent performances often provide a better indication of momentum than overall standings.
| Team | Recent Form |
|---|---|
| Perth Scorchers | W, W, W, L, W |
| Sydney Sixers | W, W, NR, W, W |
| Hobart Hurricanes | L, NR, W, W, L |
| Melbourne Stars | W, W, L, L, L |
| Brisbane Heat | W, W, L, W, L |
Teams entering the finals with strong momentum generally enjoy a significant advantage. Perth Scorchers and Sydney Sixers were among the form teams heading into the knockout rounds.
Performance Analysis
Perth Scorchers once again demonstrated why they are considered one of the most successful franchises in BBL history. Their batting lineup consistently posted competitive totals, while their bowling attack maintained pressure throughout matches.
Sydney Sixers relied on balanced performances across departments. Their ability to win crucial matches helped them secure a top-two finish.
Hobart Hurricanes impressed with several strong victories and remained among the leading teams throughout the campaign.
Melbourne Stars recovered from an inconsistent start to secure a playoff place, highlighting their resilience and squad depth.
Tournament Standings and Playoff Race
The BBL playoff system rewards the top four teams after the league stage.
| Position | Outcome |
|---|---|
| 1st | Qualified for Finals |
| 2nd | Qualified for Finals |
| 3rd | Qualified for Finals |
| 4th | Qualified for Finals |
| 5th-8th | Eliminated |
The race for the top four remained competitive throughout the season, with multiple teams remaining in contention until the final rounds of league matches.
Qualification Scenario
Teams generally need a combination of victories and a healthy net run rate to secure qualification.
Perth Scorchers comfortably qualified due to their excellent record and superior net run rate.
Sydney Sixers and Hobart Hurricanes also secured playoff positions through consistent performances.
Melbourne Stars claimed the final qualification spot after finishing ahead of Brisbane Heat in the standings.
What the Rankings Mean
Standings are more than just numbers on a table. They reflect how consistently teams perform over an entire season.
Higher-ranked teams benefit from:
- Greater confidence.
- Better playoff positioning.
- Stronger momentum.
- Improved championship chances.
Lower-ranked teams often identify weaknesses and use the offseason to strengthen their squads for future campaigns.
Top Four Teams Breakdown
Perth Scorchers
Perth Scorchers finished first due to their remarkable consistency. Their powerful batting lineup and disciplined bowling attack made them the most complete team in the competition.
Sydney Sixers
Sydney Sixers secured second place through a balanced approach and strong performances in key matches.
Hobart Hurricanes
Hobart Hurricanes enjoyed one of their strongest seasons and remained among the top teams throughout the competition.
Melbourne Stars
Melbourne Stars overcame early challenges to secure a playoff position and keep their title hopes alive.
Teams That Missed Out
| Team | Points |
|---|---|
| Brisbane Heat | 10 |
| Adelaide Strikers | 8 |
| Melbourne Renegades | 6 |
| Sydney Thunder | 4 |
Brisbane Heat narrowly missed qualification despite finishing with five victories. Adelaide Strikers, Melbourne Renegades, and Sydney Thunder struggled to maintain consistency throughout the season.
Major Records from the Season
| Record | Team |
|---|---|
| Most Wins | Perth Scorchers |
| Best Net Run Rate | Perth Scorchers (+1.363) |
| Most Points | Perth Scorchers (14) |
| Highest Ranked Qualifier | Perth Scorchers |
| Closest Playoff Race | Melbourne Stars vs Brisbane Heat |
These records highlight the dominance of Perth Scorchers and the competitiveness of the playoff race.
Impact of Net Run Rate
Net run rate is often the deciding factor when teams finish level on points.
A strong NRR can:
- Improve final rankings.
- Secure playoff qualification.
- Separate tied teams.
- Strengthen championship opportunities.
Sydney Sixers finished above Hobart Hurricanes because of a superior net run rate despite both teams earning the same number of points.
Why the Standings Matter
The Big Bash League standings determine which teams qualify for the finals and ultimately compete for the championship.
They also provide insight into:
- Team consistency.
- Strength of batting and bowling units.
- Playoff readiness.
- Overall tournament performance.
For fans, the standings create excitement and add significance to every match during the league stage.
Frequently Asked Questions
What is the Big Bash League standings table?
The standings table ranks teams based on points earned through victories, with net run rate acting as the tiebreaker when teams finish level on points.
Which team finished first in the latest Big Bash League standings?
Perth Scorchers finished at the top of the table with 14 points and the best net run rate in the competition.
How many teams qualify for the BBL finals?
The top four teams in the standings qualify for the finals series.
Why is net run rate important in the standings?
Net run rate separates teams that finish with the same number of points and can determine qualification or final rankings.
Which teams qualified for the playoffs?
Perth Scorchers, Sydney Sixers, Hobart Hurricanes, and Melbourne Stars secured playoff qualification.
Conclusion
The Big Bash League standings provide a complete picture of team performance throughout the season. Perth Scorchers emerged as the standout side, finishing first with the highest points total and best net run rate. Sydney Sixers, Hobart Hurricanes, and Melbourne Stars also secured playoff positions through consistent performances. Meanwhile, Brisbane Heat narrowly missed qualification despite a competitive campaign. As the BBL continues to grow in popularity, the standings remain one of the most closely followed aspects of the tournament, shaping playoff races, championship ambitions, and unforgettable cricket moments.